
monitor program performance …
Effective loyalty and incentive program management requires easy-to-use and readily available reports and dashboards to monitor program performance and inform strategic and tactical decisions for program improvement.
Vanson provides a comprehensive set of reports and dashboards. Standard reporting includes purchase history, earnings history, redemption history, point liability, program budget, and more. Vanson can also create additional reports from virtually any data that is collected. All reports can be presented in multiple forms, including Excel spreadsheets, graphs, charts, tables, etc. The ability to convert reports using Excel enables our clients to manipulate data in multiple ways.
more…
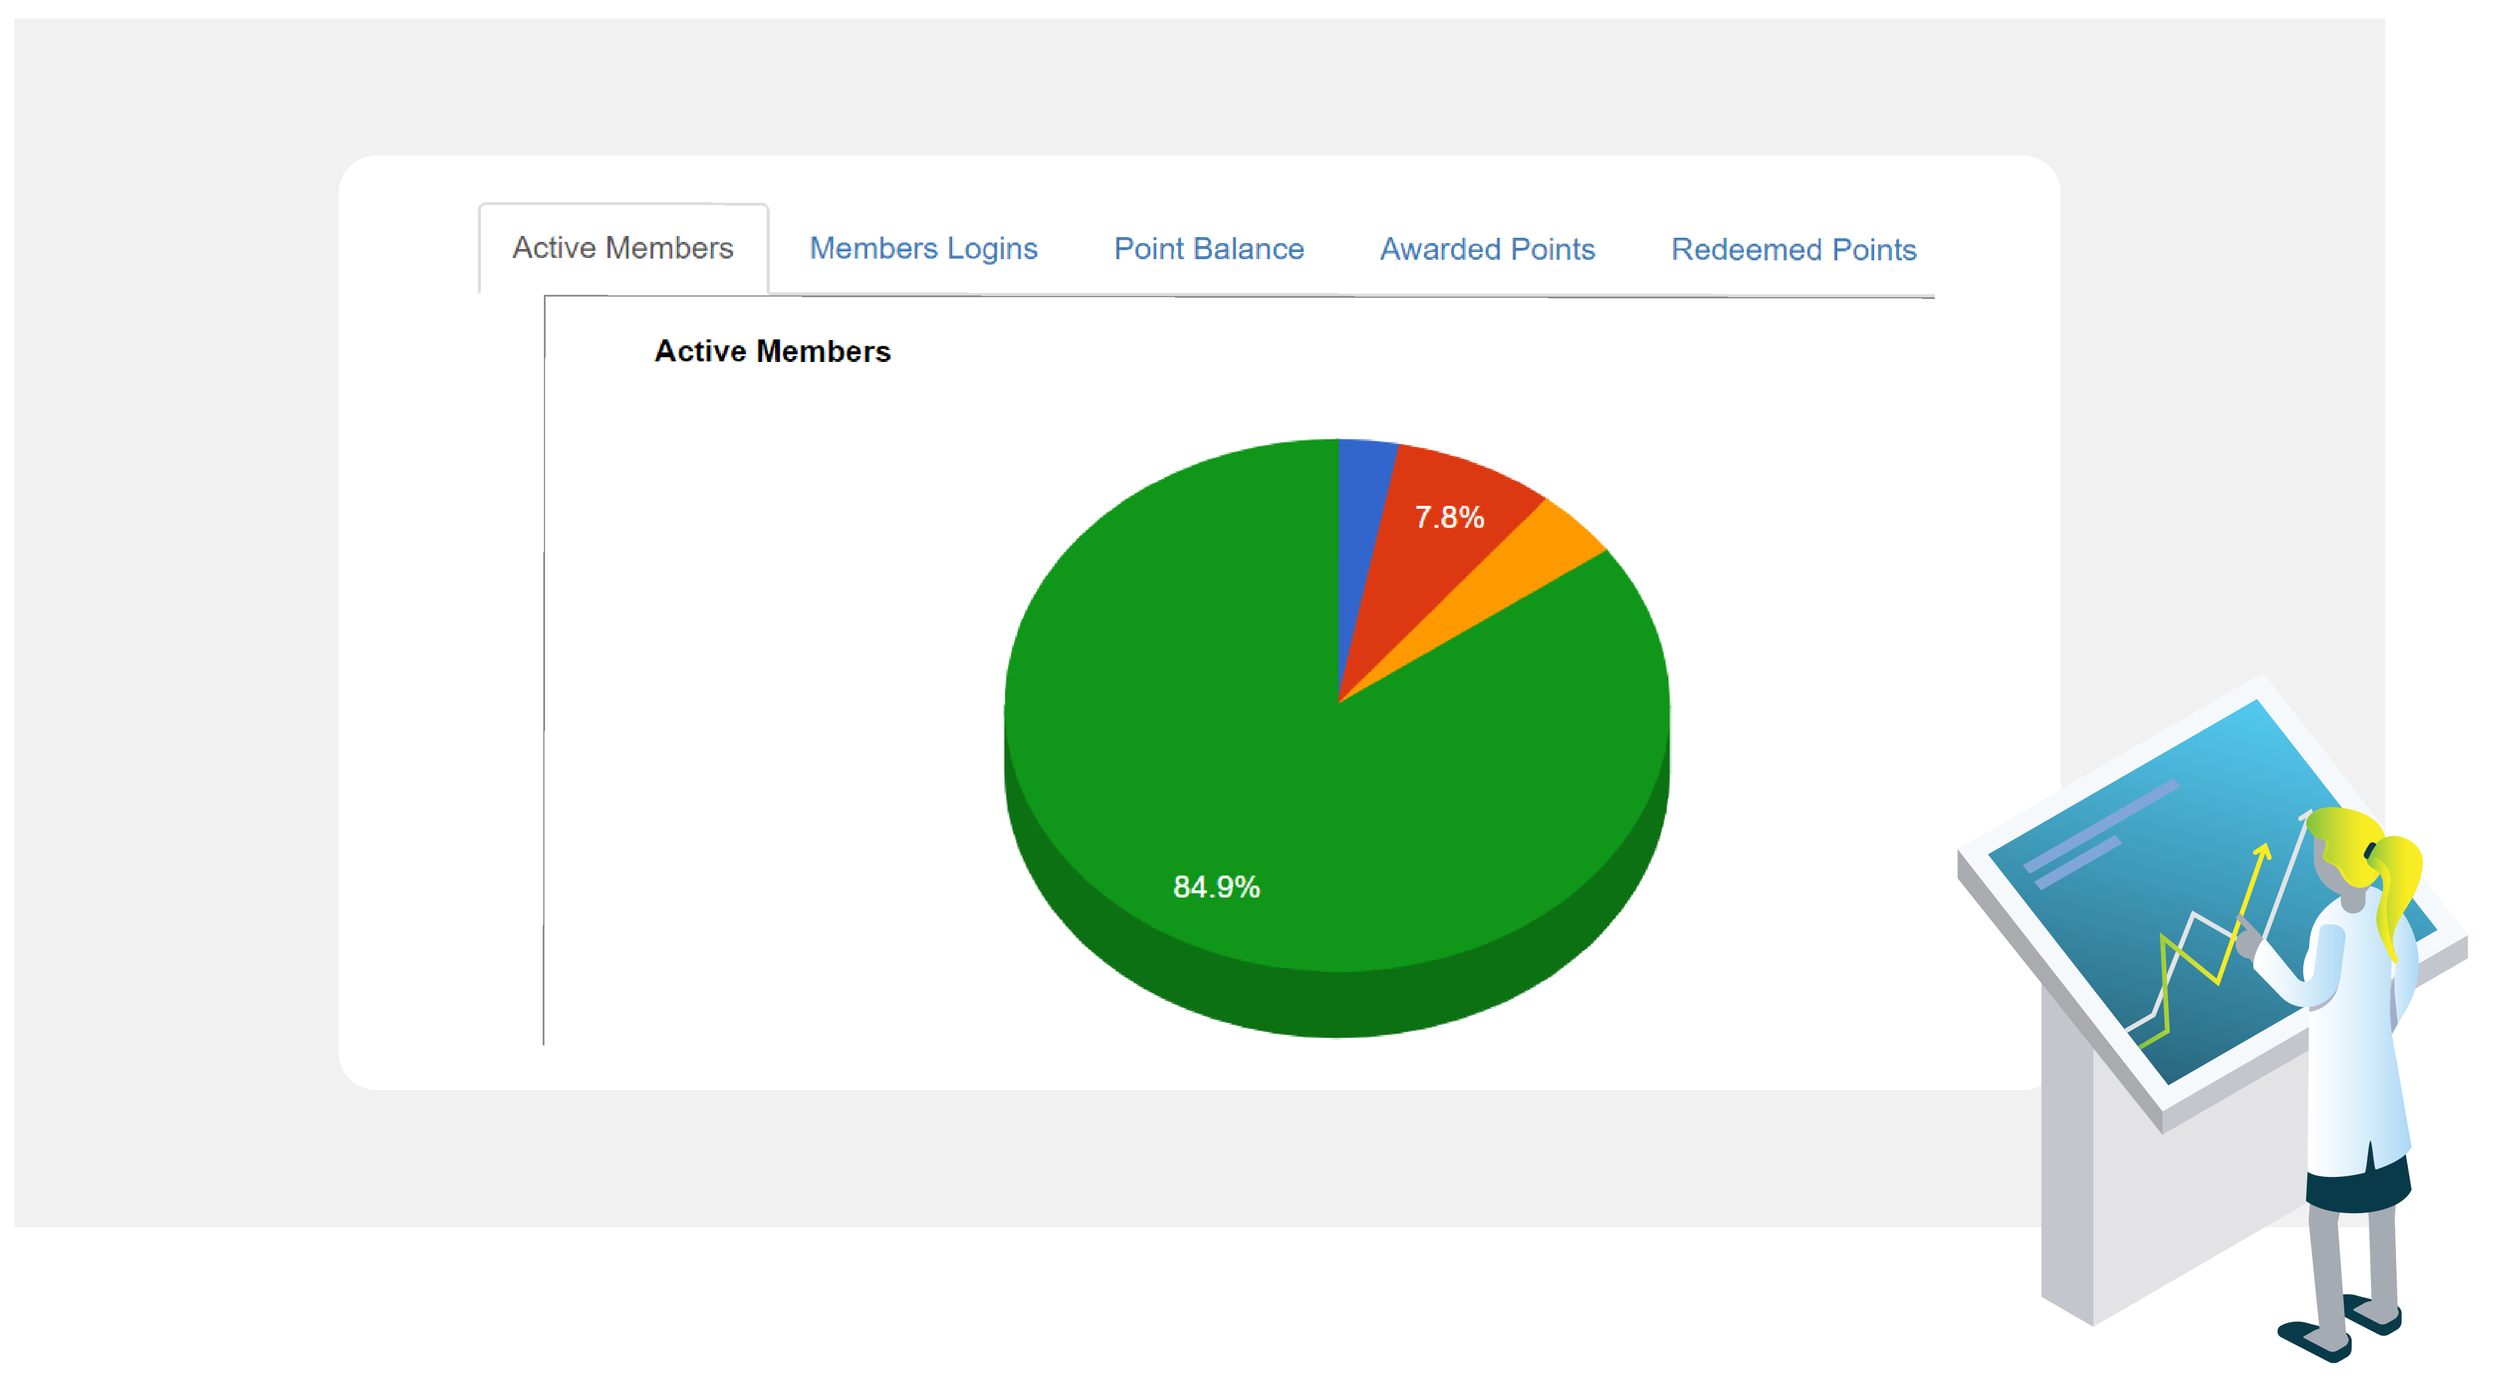
Dashboards include key information that program administrators want to see at a glance. A typical dashboard may include a summary slide showing number of active participants, number of awarded points, sales associated with the program, a ‘map view’ showing sales by country & state, a graphic that shows sales by month and day, a pie chart showing sales or earnings by brand, top 10 participants or earners, and more. Dashboards can be filtered to show data by time period (e.g., year or quarter) and by brand, among other options.
